Market Commentary

Matt McKinney312-277-0115
mmckinney@zaner.com
TODAY'S FEATURE
(10/3/2016 1:42:51 PM)
Grain Options Play: Corn, Beans Harvest Rally In Play?
Direct-312-277-0115, http://www.mmckinneyfutures.com/
TRADING COMMODITY FUTURES AND OPTIONS INVOLVES SUBSTANTIAL RISK OF LOSS AND MAY NOT BE SUITABLE FOR ALL INVESTORS. YOU SHOULD CAREFULLY CONSIDER WHETHER TRADING IS SUITABLE FOR YOU IN LIGHT OF YOUR CIRCUMSTANCES, KNOWLEDGE AND FINANCIAL RESOURCES.
Grain Options Play: Corn, Beans Harvest Rally In Play?
With Harvest Upon Us Corn Breaks Out To The Upside And Beans Pop Higher As We Begin The Month Of October.
Fundamentally, with Harvest Days upon us both the Corn and Soybeans spiked higher as we began the month of October. On the CME Corn lead the way up 9 cents/bushel, while beans rallied up 20 cents/bushel. With the bar set so high in terms of a bumper to record harvest this year, I don't think expectations will be met.
While there are burdensome supplies of Corn in China I look for demand to increase as we head into November and the end of 2016. In fact, 2.4 million tonnes of 2013 Corn was sold at auction in China on Friday, this according to Hightower reports. And while many didn't think this was good, I think its a start of more demand to come.
Up until now Corn demand has taken a back seat to Soybean demand which has remained robust all year long, as the world continues to show that it loves our Soybeans. Imagine what prices can do if Corn decides to join the party and demand kicks in?
For Our Zaner Daily Commentary:http://www.zaner.com/offers/?page=16&ap=mmckinne
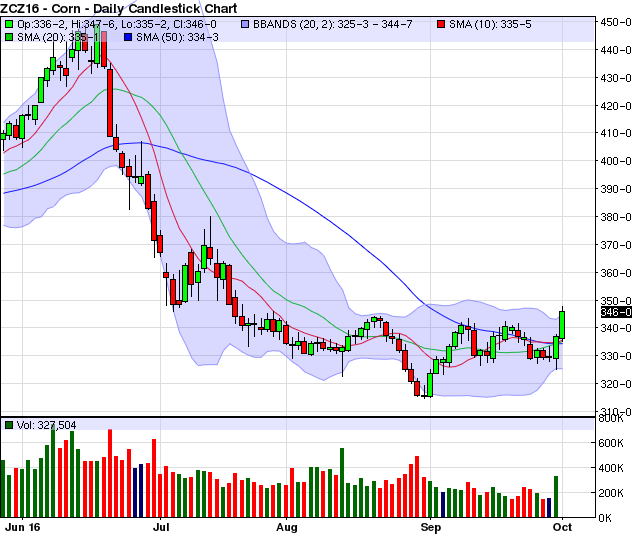
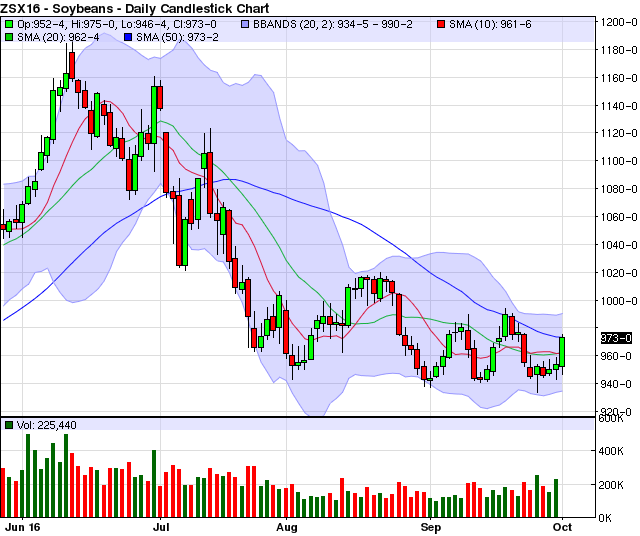
Technically, I have added my favorite technical indicators to the charts below. I have coined them the "10/20/50/BB Trend Finder". They are the 10 (red line), 20 (green line), and the 50 (blue line) day Simple Moving Averages or SMAs. I have also added Bollinger Bands or BBs (light blue shaded area) and Candlesticks (the red and green bars with the candlestick wicks, and on this daily chart each bar represents one day of trading).
These few technical indicators can tell me many, many different characteristics about the market at a quick glance so I have them saved on my charts in MARKETHEAD, so they can populate on any chart I choose at the click of a mouse.

On the daily Corn chart above, the Corn market has posted a major break out to the upside as all previous highs of the last 60 days have been taken out.

On the daily Soybean chart above the market has posted a rally higher as the market rallied up and through the resistance of both the 10 and 20 day SMAs.
I figured all this out by putting my "10/20/50/BB Trend Finder" on the chart above and applying these indicators to the charts at the click of a mouse which I found at: http://www.markethead.com/2.0/free_trial.asp?ap=mmckinne, which is a web application that we have developed for our clients called MARKETHEAD where I get about 70-80% of all my research from. That means I get both technical and fundamental research from this web app and I am a veteran series 3 Broker of 17 years. So if Im using it then maybe my readers should check it out. Yes?
Grain Options Play:
One potential strategy could be to buy Bull Call Spreads and in a 3 to 1 ratio a Put. For exact details on this strategy, months, expiration dates, strike prices, and number of positions feel free to contact me at 312-277-0115 or mmckinney@zaner.com.
CME Options On Futures: The Basics: http://www.zaner.com/offers/?page=9&ap=mmckinne
FREE QUOTE- "Success is not final, failure is not fatal: it is the courage to continue that counts."
-Winston Churchill
FUTURES, OPTIONS AND FOREX TRADING IS SPECULATIVE IN NATURE AND INVOLVES SUBSTANTIAL RISK OF LOSS. THESE RECOMMENDATIONS ARE A SOLICITATION FOR ENTERING INTO DERIVATIVES TRANSACTIONS. ALL KNOWN NEWS AND EVENTS HAVE ALREADY BEEN FACTORED INTO THE PRICE OF THE UNDERLYING DERIVATIVES DISCUSSED. FROM TIME TO TIME PERSONS AFFILIATED WITH ZANER, OR ITS ASSOCIATED COMPANIES, MAY HAVE POSITIONS IN RECOMMENDED AND OTHER DERIVATIVES.
FOR CUSTOMERS TRADING OPTIONS, THESE FUTURES CHARTS ARE PRESENTED FOR INFORMATIONAL PURPOSES ONLY. THEY ARE INTENDED TO SHOW HOW INVESTING IN OPTIONS CAN DEPEND ON THE UNDERDLYING FUTURES PRICES; SPECIFICALLY, WHETHER OR NOT AN OPTION PURCHASER IS BUYING AN IN-THE-MONEY, AT-THE-MONEY, OR OUT-OF-THE MONEY OPTION. FURTHERMORE, THE PURCHASER WILL BE ABLE TO DETERMINE WHETHER OR NOT TO EXERCISE HIS RIGHT ON AN OPTION DEPENDING ON HOW THE OPTION'S STICKE PRICE COMPARES TO THE UNDERLYING FUTURE'S PRICE. THE FUTURES CHARTS ARE NOT INTENDED TO IMPLY THAT OPTION PRICES MOVE IN TANDEM WITH FUTURES PRICES. IN FACT OPTIONS PRICES MAY ONLY MOVE A LITTLE.
THE LIMITED RISK CHARACTERISTIC OF OPTIONS REFERS TO LONG OPTIONS ONLY AND REFERS TO THE AMOUNT OF THE LOSS, WHICH IS DEFINED AS THE PREMIUM PAID ON THE OPTION(S) PLUS FEES.
Click here to read my full story and thoughts on other markets I follow.
Futures, options and forex trading is speculative in nature and involves substantial risk of loss. These recommendations are a solicitation for entering into derivatives transactions. All known news and events have already been factored into the price of the underlying derivatives discussed. From time to time persons affiliated with Zaner, or its associated companies, may have positions in recommended and other derivatives.


 Connect with us on Facebook
 Follow us on Twitter
 Google Plus
 See us at LinkedIn